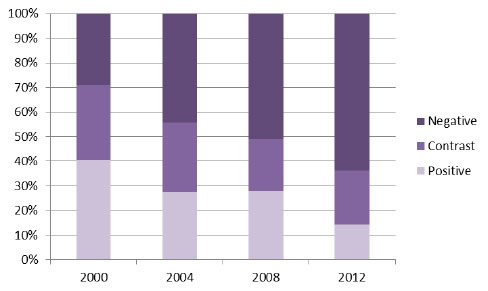
This chart, produced by the Wesleyan Media Project, breaks down the percentages of ad genres by political campaigns in recent election cycles from 2000 to 2012.2 In 2000, around 30% of ads negative, 30% contrasted the candidates to each other, and nearly 40% were positive. By 2012, nearly 65% of ads were negative, another 20% were contrasting, and only around 15% were positive. The shift towards using attack ads to portray an opponent in a negative light began to pick up speed in the 1992 election, but this chart illustrates how much the use of negative ads continued to grow in the 21stcentury.
2. Ordway, Denise-Marie. “Negative Political Ads and Their Effect on Voters: Updated Collection of Research.” Journalist’s Resource, 20 Dec. 2016, journalistsresource.org/studies/politics/ads-public-opinion/negative-political-ads-effects-voters-research-roundup/.
